Your Physiological Profile charts (Figure 4) provide an indication of how your physiology works to achieve your performance capability over different exercise durations. We are all unique in this regard, which is why it's so important to individualize training in line with how you function. In particular, this chart provides an indication of your aerobic (endurance) and anaerobic (sprint) performance potential over set time periods. Your Physiological Profile is the best indicator of your capacity to perform across exercise durations that compare with those of the event you are training for. Combined, your Physiological Profile assists us to accurately determine your exercise training zones and an optimal pacing profile for your upcoming event.
Series Definitions
- Critical power/speed (CP/CS)
- This refers to the three model's described in the literature. The model represents your theoretical maximal power sustainable over a given period of time assuming constant speed/power. We have found this to be most accurate between the 2-60 minute range.
- Critical power/pace from model
- We use the model defined above fitted to your data to calculate your CP/CS.
- Observed peak power/speed
- Your peaks for the given time period tracked over various durations given the data we have from your activities.
- Critical power/speed of best 20 minute effort
- We obtain this value by looking at your best 20 minute efforts in the given time period.
- Critical power/speed of best 60 minute effort
- We obtain this value by looking at your best 60 minute efforts in the given time period.
- VT1 (predicted)
- Own own implementation of what your VT1 is.
- VT2 threshold from user settings
- This is the value you have set under your own settings.
- APR Model
- The anaerobic power/speed reserve model (APR/ASR) developed by Weyand et al. provides a good estimation of your power/speed values in the very intense exercise domain. We utilise this model for your HIIT training prescriptions and tracking your progress.
- OmPD Model
- The Omni power duration/speed model (OmPD/OmSD) developed by Puchowicz et all. tries to model performance across a broad duration range. It's useful for tracking your performance across the whole spectrum.
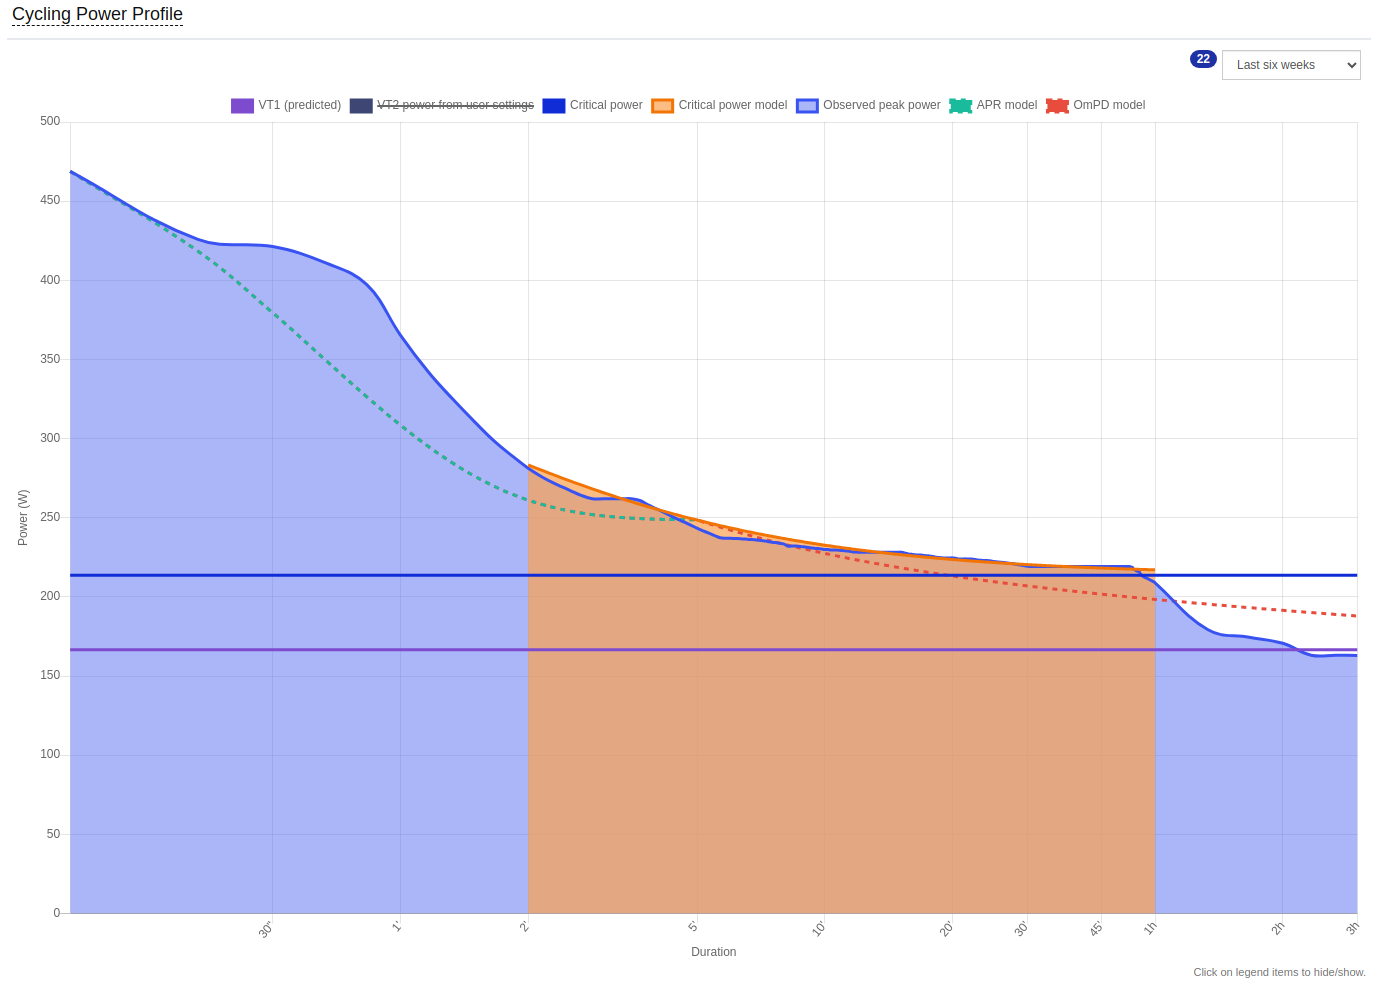
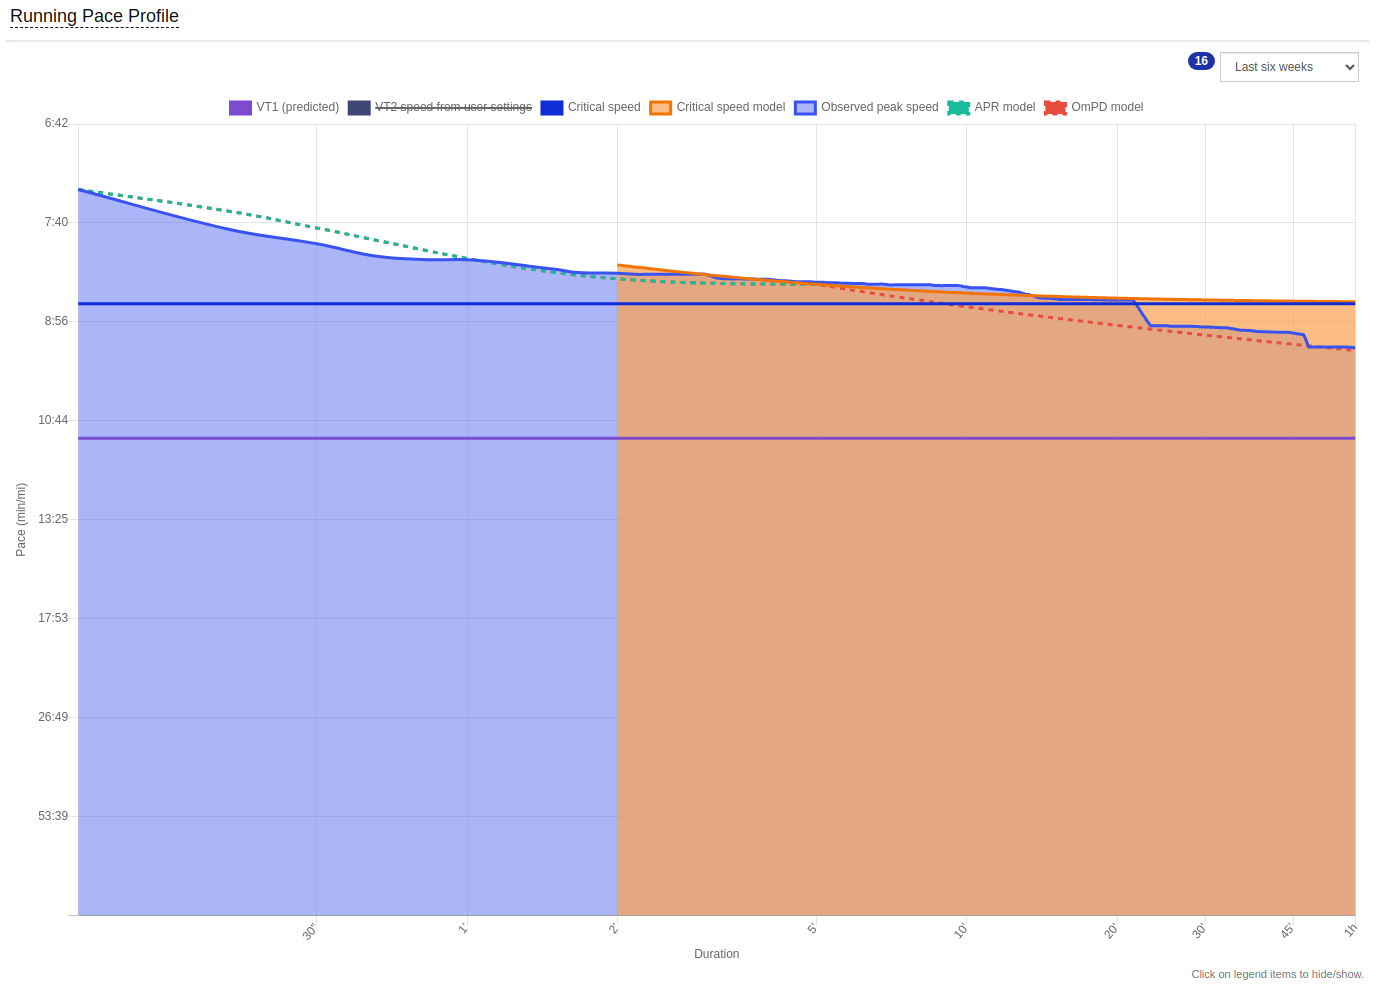
Figure 4. Physiological profile chart showing an individual’s power response over different training durations during cycling, and run paces over varying training durations.
Comments
0 comments
Please sign in to leave a comment.